The Platform Dashboard gives a single view of how complete and well-governed assets are, and how Quest DI adopted. Use it to:
-
Find assets that are incomplete or have no owner.
-
Compare governance across catalogs.
-
Track onboarding, activity, and engagement.
The Platform Dashboard has three modules:
|
Module |
Use It To |
|---|---|
|
Data Governance |
Check the completeness and governance of business assets. |
|
Data Marketplace |
Check the completeness and governance of marketplace assets. |
|
User Engagement |
Track the onboarding and activity of users.. |
You can filter the data by time period, point to a widget to see how it is calculated, and click a number to open the assets or accounts behind it. To change how the dashboard calculates completeness and score colors, and which roles it includes, refer to the Configuring Dashboard Widgets section.
In Quest DI 16.2, the new dashboard opens by default. You can switch to the earlier dashboard using the Old Dashboard toggle. For more information, refer to the Old Platform Dashboard section. The Platform Dashboard permissions are required to view the dashboard. For more information, refer to the Creating Roles topic.
Accessing the Platform Dashboard
To access the Platform Dashboard, go to Application Menu > Platform Dashboard.
The Data Governance Insights page appears.
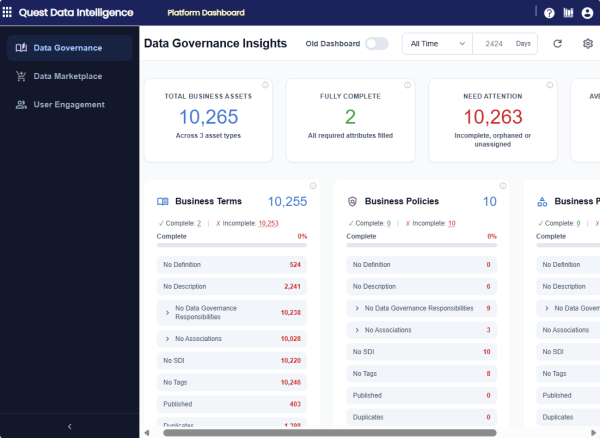
The left pane lists the modules that the role can access. Click a module to view its insights. To collapse or expand the pane, click  at the bottom of the pane.
The following table describes the options at the top of the dashboard.
|
UI Element |
Function |
|---|---|
|
Old Dashboard |
Switches to the earlier dashboard. The toggle is off by default. |
|
Time period list |
Filters all the widgets by the selected time period. |
|
days |
Displays the number of days in the selected time period. |
|
|
Reloads the data on the dashboard. |
|
|
Opens the Widget Configuration dialog box. This icon is available only if your role has the Settings permission. |
 (Refresh)
Filtering data by time period
All the widgets display data for the selected time period. By default, the dashboard displays data for the last 30 days. To analyze recent activity or long-term trends, change the time period.
To filter the data by time period, follow these steps:
-
At the top of the dashboard, click the time period list.
-
Select Last 30 days, Last 45 days, Last 90 days, All time, or Custom.
-
If you select Custom, enter the number of days in the days box, and then press Enter.
The dashboard refreshes, and the widget titles show the selected time period.
Data Governance
The Data Governance module shows how complete and well-governed business assets are (for example, business terms, business rules, policies, and business elements). An asset is complete when it has all the attributes that are turned on in the Asset Details tab of the Widget Configuration dialog box. The completeness percentage is calculated as follows:
Completeness % = (Number of fully complete assets / Total number of assets) × 100
The following screenshot displays the summary cards, the asset type cards, and the catalog widgets.
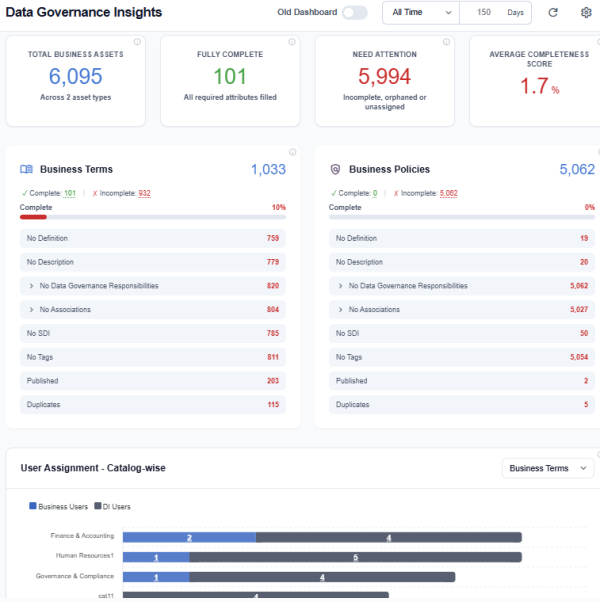
The module has the following widgets:
|
Widget |
Description |
|---|---|
|
Total Business Assets |
Displays the total number of business assets. |
|
Fully Complete |
Displays the number of assets that have all the required attributes. |
|
Need Attention |
Displays the number of assets that are incomplete, orphaned, or unassigned. |
|
Average Completeness Score |
Displays the average completeness percentage. |
|
Asset type cards, such as Business Terms |
Displays the completeness of each asset type. |
|
User Assignment - Catalog-wise |
Displays the number of business users and DI users assigned to each catalog. |
|
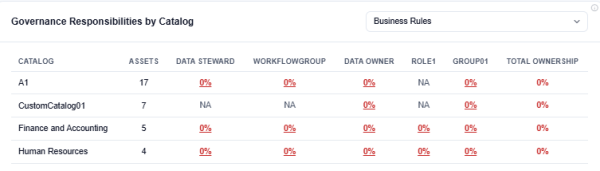
Governance Responsibilities by Catalog |
Displays the percentage of assets in each catalog that have each responsibility assigned (for example, Data Steward and Data Owner). NA means that the responsibility is not defined for the catalog. 0% means that the responsibility is defined, but no one is assigned. |
|
Catalog Distribution |
Displays the number of assets in each catalog. |
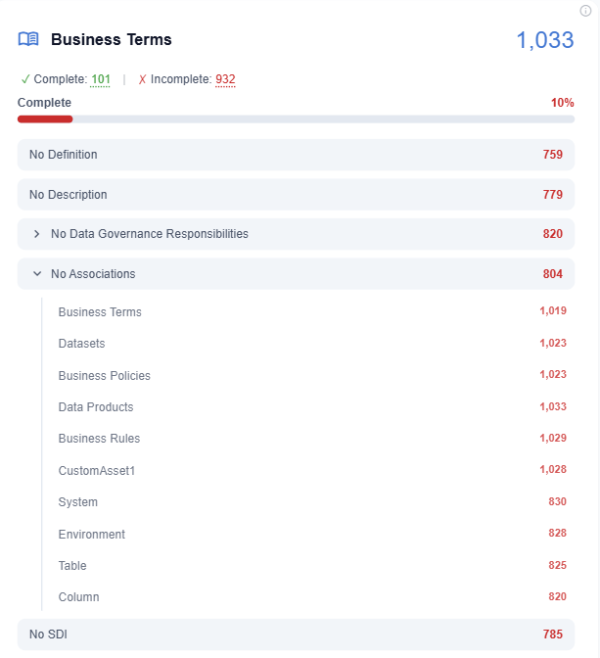
To check the completeness of an asset type, follow these steps:
-
In the Data Governance module, locate the card of the asset type. For example, Business Terms.
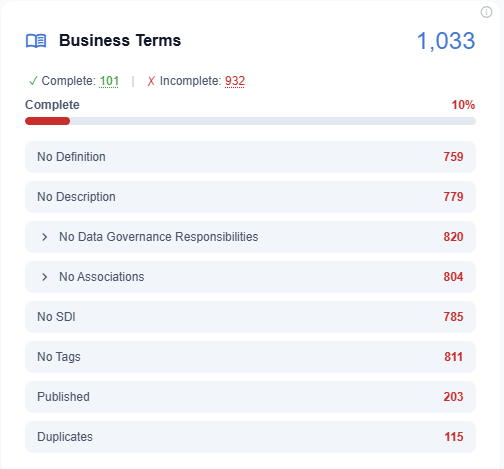
The card shows the total number of assets and a Complete bar.
-
Review the number of assets that have each gap.
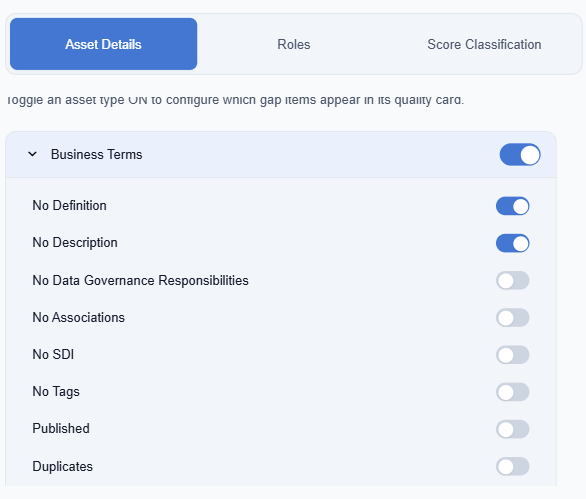
The card shows only the attributes that are turned on in the Asset Details tab. For example, No Definition, No Description, No Data Governance responsibilities, No Associations, No SDI (sensitive data indicator), No Tags, Duplicates, and Published.
-
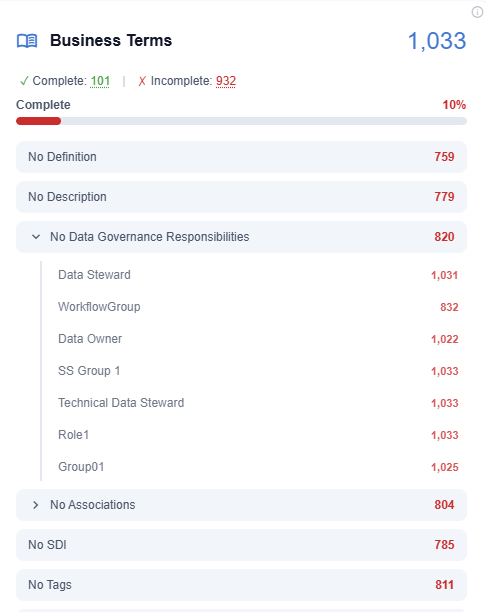
To view the count for each responsibility, for example, No Data Steward, expand No Data Governance Responsibilities.
-
To view the count for each association type, such as Tables or Columns, expand No Associations.
Work with widgets
Each card displays numbers, charts, tables, or graphs that give a snapshot of the data. The widgets work in the same way in all the modules. Scores appear in red, yellow, or green according to the ranges that are set in the Score Classification tab.
To explore a widget, follow these steps:
-
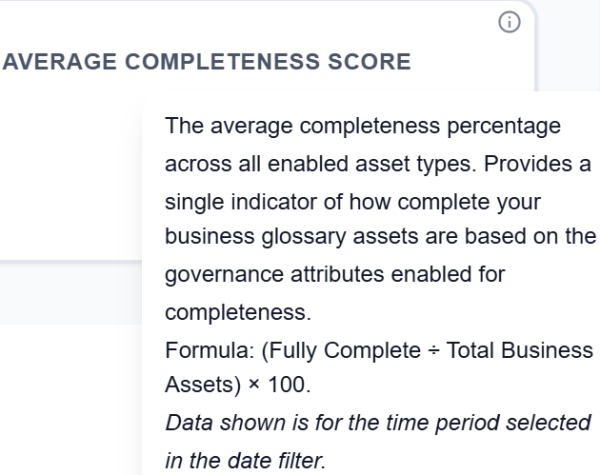
To view the description, formula, and time period of a widget, hover over
 at the top-right corner of the widget. For example, hover over on Average Completeness Score card to view how the score is calculated.
-
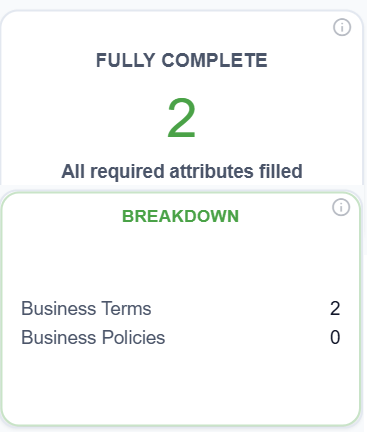
To view the breakdown of a summary card by asset type, hover over the card. For example, hover over Fully Complete to view the number of complete assets of each asset type.
-
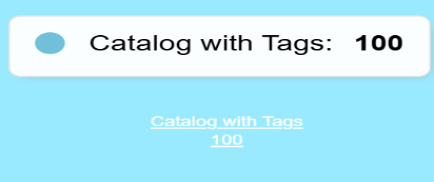
To view the value of a chart element, hover over a bar, point, or tile. For example, hover over a bar in Catalog Distribution to view the number of assets in that catalog.
-
To change the asset type, select a type from the list at the top-right corner of the widget. For example, select Business Rules to view the widget data for business rules.
To view and update the assets behind a number, follow these steps:
-
Click the number.
For example, click the number next to No Definition on the Business Terms card.
A dialog box opens with the name of the selected gap as its title, for example, No Definition. Below the title, a summary shows the asset type, the total number of assets, and the number of items in the list. For example, Business Terms · 760 assets · 760 items.
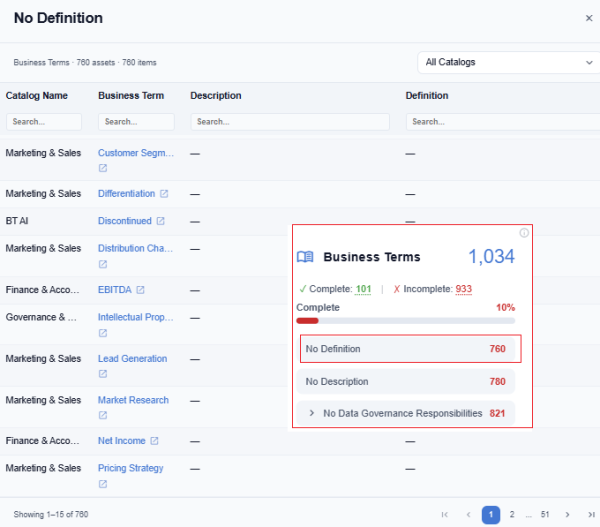
The list shows the Catalog Name column, the asset name column (for example, Business Term), and the columns that relate to the selected gap (for example, Description and Definition).
-
To view the assets of one catalog, select the catalog from the list at the top-right corner of the dialog box.
By default, All Catalogs is selected.
-
To find a specific asset, enter text in the search box under a column heading. For example, enter a catalog name in the search box under Catalog Name.
-
Click
 next to the asset name.
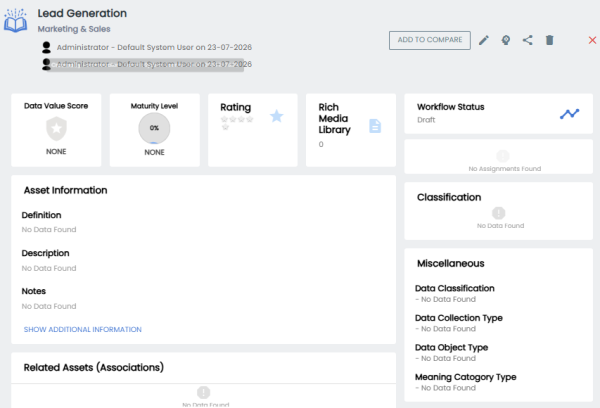
The asset opens in its module. For example, a business term opens in the Business Glossary Manager.
-
Add the missing information.
For example, add a definition to the business term, and then save the changes.
Data Marketplace
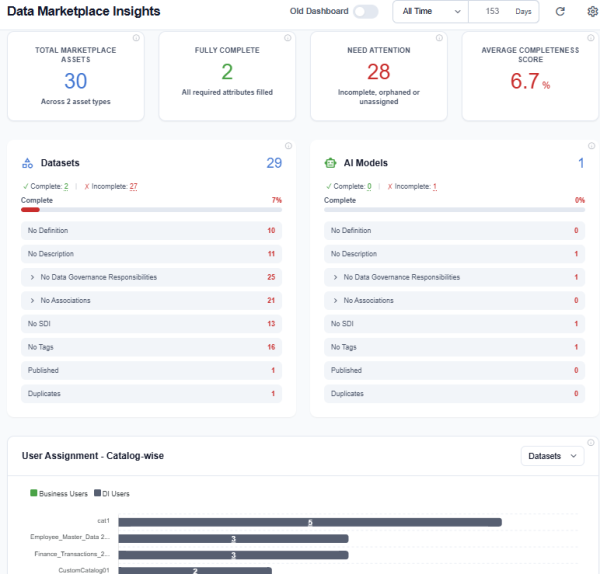
The Data Marketplace module shows how complete and well-governed marketplace assets are (for example, data products, datasets, AI models, and AI agents). It has the same widgets as the Data Governance module, and the widgets work in the same way. For more information, refer to the Work with widgets section.
User Engagement
The User Engagement module shows how users interact with Quest DI. A user is active if the user has at least one session in the selected time period. Otherwise, the user is inactive.
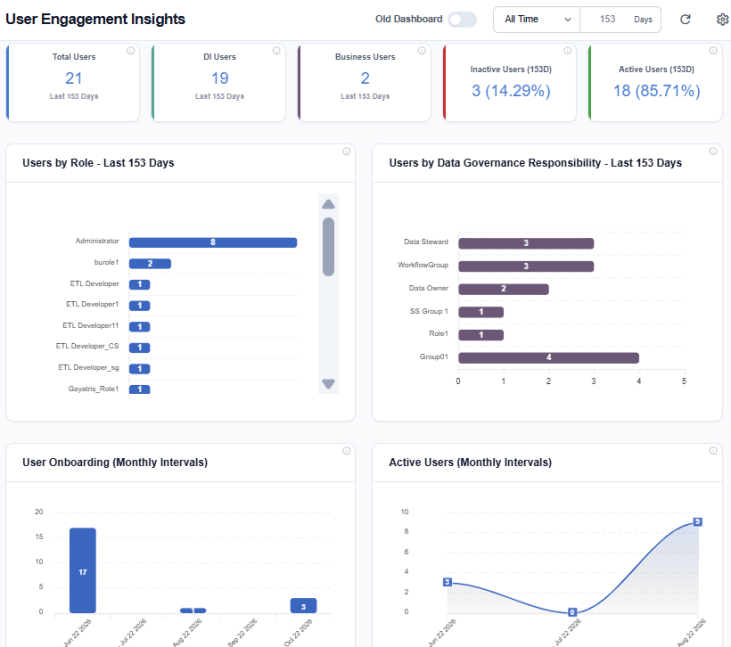
The module has the following widgets:
|
Widget |
Description |
|---|---|
|
Summary cards |
Display the number of total users, DI users, and business users, and the percentage of active and inactive users. |
|
Users by role and responsibility |
Display the number of users in each role and in each data governance responsibility. |
|
User onboarding and active users |
Display the number of new users and active users in each interval of the time period. |
|
Login and session widgets |
Display the average sign-ins per week for each role, and the percentage of sessions by duration. |
|
Top Active Users |
Displays the most active users. To view the least active users, select Inactive Users from the list. |
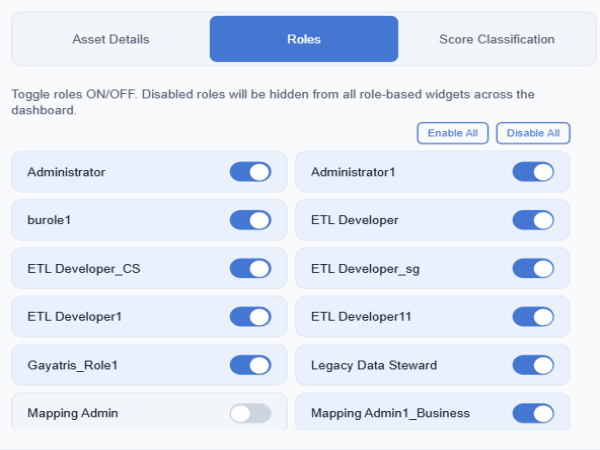
To view the description and formula of any widget, hover over . For more information, refer to the Work with Widgets section. The widgets include only the roles that are turned on in the Roles tab of the Widget Configuration dialog box.
Configuring Dashboard Widgets
Use the Widget Configuration dialog box to define how the dashboard calculates and displays data. The settings apply to all users. To configure the dashboard, your role must have the Platform Dashboard > Settings permission.
To configure widget, follow these steps:
-
Click
 .
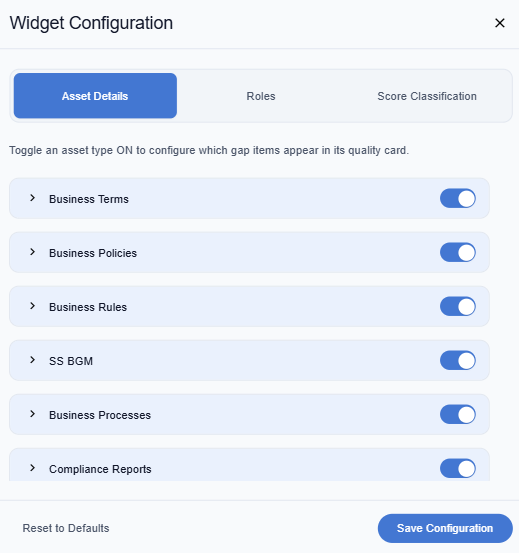
The Widget Configuration dialog box appears.
-
On the Assets Details tab, turn on the toggle of each asset type to display.
-
Expand the asset type, and then turn on the attributes that an asset must have to be complete. For example, to treat a business term as complete only when it has a definition and a description, turn on No Definition and No Description.
-
On the Roles tab, turn on the roles to include in the User Engagement module. For example, turn off administrative roles so that their frequent sign-ins do not affect the adoption metrics.
-
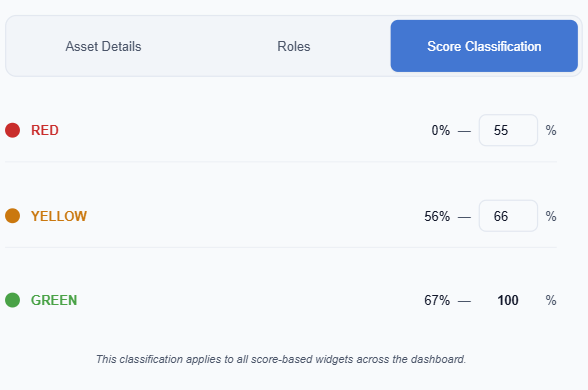
On the Score Classification tab, enter the upper limit of the RED range and the upper limit of the YELLOW range.
The red range starts at 0%, and the green range ends at 100%. The lower limit of the next range updates automatically. For example, if you change the RED limit to 55, the yellow range starts at 56%.
-
Click Save Configuration.
The dashboard recalculates the data with the new settings.
To return to the default settings, click Reset to Defaults.
 Old Platform Dashboard
The earlier dashboard shows an overview of metadata, mapping, marketplace, data source, and activity metrics by catalog. To switch between the dashboards, turn the Old Dashboard toggle on or off at the top of the dashboard.
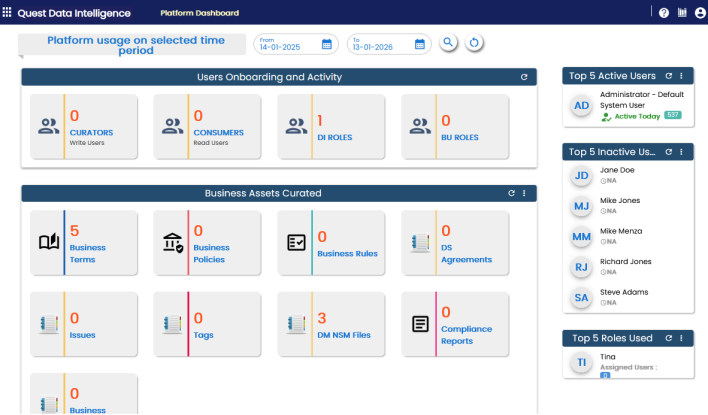
Each card is clickable and displays information using charts or graphs that provide a snapshot of the underlying data.
To filter the platform usage by period, follow these steps:
-
Under From and To, click
 , and then select dates.
-
Click
 .
To reset the results, click  .
The following table describes the sections of the old dashboard:
|
UI Section |
Function |
|---|---|
|
Users Onboarding and Activity |
Displays the number of Curators (Write Users), Consumers (Read Users), DI Roles, and BU Roles. |
|
Business Assets Curated |
Displays the number of each type of business asset. |
|
Business Categories Curated |
Displays the number of each type of business category. This section is available only when you switch to Categories. To view this section, click |
|
Marketplace Assets Curated |
Displays the number of each type of marketplace asset. |
|
Marketplace Categories Curated |
Displays the number of each type of marketplace category. This section is available only when you switch to Categories. To view this section, click |
|
Data Sources Activity |
Displays the number of onboarded and refreshed data sources. |
|
Source To Target Mappings and Reference Data |
Displays the number of source to target mappings and reference data. |
|
Top 5 Active Users |
Displays a list of top five active users based on login count. |
|
Top 5 Inactive Users |
Displays a list of top five inactive users based on login count. |
|
Top 5 Roles Used |
Displays a list of top five roles based on login count. |
 on the section title bar and select Categories.
Using the platform dashboard, you can view and analyze activity and usages of the following modules: